Data, Mapping, Intelligence: The 3-Layer System Behind Every Caly Report

28 JULY 2026
•
9 MIN READ
Introduction
A product carbon footprint report is only as reliable as the data and methodology behind it. Yet one of the most common challenges in carbon reporting is traceability: understanding exactly which emission factors, material assumptions, and supplier data contributed to the final result. When stakeholders ask how a specific number was calculated, teams often have to work backwards through spreadsheets, assumptions, and data sources to find the answer. Without clear visibility into that process, reviewing, validating, and defending a product carbon footprint becomes significantly harder.
Caly, Carbalyze's AI sustainability assistant, is designed to make product carbon footprint reporting more transparent and accessible. Behind every report is a workflow that runs through three stages: Data, Mapping, and Intelligence. First, product data is collected from your Bill of Materials. Next, materials and suppliers are matched to relevant emission factors. Finally, the results are transformed into audit-ready reports, hotspot analysis, and reduction opportunities. Together, these stages help turn a raw BOM into carbon insights that sustainability, procurement, and product teams can use to support reporting and decision-making.
This blog explores how each stage works together to transform product data into a traceable Product Carbon Footprint.
What "Data, Mapping, Intelligence" Actually Means
Before exploring each stage in detail, it helps to define the framework in simple terms.
Data
The foundation: The Bill of Materials (BOM), supplier information, quantities, and other product data used to calculate a footprint.
Mapping
The analysis stage: Materials and suppliers are matched to relevant emission factors using industry-standard databases.
Intelligence
The outcome: Emissions calculations are transformed into audit-ready reports, hotspot analysis, supplier insights, and reduction opportunities.
Together, these stages create a structured path from product data collection to carbon insights and reporting.
Layer 1: Data, Turning Your BOM Into a Usable Foundation
Every Product Carbon Footprint starts with data, and for most manufacturers, that data begins with a Bill of Materials (BOM). A BOM contains the materials, components, quantities, and supplier information that make up a product, making it the natural foundation for carbon footprint analysis. Yet BOMs are typically created for procurement and manufacturing, not carbon reporting. As a result, information can be incomplete, inconsistent, or difficult to use directly in emissions calculations.
Consider a simple BOM line item: Aluminum bracket, 0.4 kg, Supplier B. On its own, that entry provides limited insight into its carbon impact. To calculate emissions accurately, the material must first be identified, structured, and prepared for analysis. When a product contains hundreds of line items, this preparation step becomes essential to producing a reliable Product Carbon Footprint.
With Caly, the process begins by uploading a BOM in Excel or CSV format. Whether the file contains raw materials, components, or finished products, the platform automatically ingests the data and prepares it for carbon analysis. No manual data entry or extensive spreadsheet preparation is required, allowing teams to move directly from product data to emissions analysis.
That structured data becomes the foundation for the mapping stage that follows.
Layer 2: Mapping, Where Caly Does the Heavy Lifting
After data preparation, Caly maps materials, components, and supplier information against industry-standard emission factor databases to support product-level emissions calculations. Instead of manually searching for emissions values across multiple sources, teams can rely on automated material-level mapping that prepares each line item for carbon calculation. From plastics and metals to assemblies and purchased components, every item is evaluated individually to build a more detailed emissions profile.
Take the aluminum bracket from the earlier example. During the mapping stage, Caly identifies the material, quantity, and available supplier context, then matches that information to the most appropriate emission factors. This creates the foundation for accurate emissions calculations at the material level rather than relying solely on broad product averages.
Scope 3 emissions are often the most challenging part of Product Carbon Footprint reporting because data availability varies across suppliers and product categories. To support consistent calculations, Caly uses supplier-specific emissions data where available and supplements gaps with industry-standard emission factors. This enables manufacturers to continue building a comprehensive Product Carbon Footprint while maintaining calculation coverage across different levels of supplier data availability.
By mapping emissions at the material and supplier level, the resulting footprint becomes more granular and actionable. Rather than producing a single carbon score with limited context, the process helps identify which materials, suppliers, or product components contribute most to overall emissions, creating the foundation for hotspot analysis and reduction opportunities in the next stage.
Layer 3: Intelligence, From Numbers to Action
The Intelligence layer transforms those emissions calculations into audit-ready reporting and actionable sustainability insights.
On the reporting side, Caly generates Product Carbon Footprint reports aligned with the GHG Protocol, ISO 14067, and CSRD requirements. These reports provide a structured view of product emissions, supported by the calculations generated throughout the workflow.
On the insights side, Caly goes beyond producing a carbon score. The platform identifies emission hotspots across materials, suppliers, and product components, helping teams understand what contributes most to a product's footprint. It also provides supplier insights and reduction recommendations that can support sourcing, procurement, and product design decisions.
Consider the aluminum bracket example from the previous section. If that component contributes a disproportionately high share of emissions, Caly highlights it as a hotspot and brings it into focus alongside other significant contributors. Instead of reviewing emissions line by line in a spreadsheet, teams can quickly identify where attention and reduction efforts are likely to have the greatest impact.
This distinction is important. A Product Carbon Footprint report should do more than quantify emissions; it should help organisations understand what is driving those emissions. Hotspot analysis, supplier insights, and reduction recommendations provide the context needed to move from measurement to action, helping teams prioritise improvement opportunities across products and supply chains.
How the Three Layers Work Together
Each stage feeds directly into the next — a BOM upload flows into material-level mapping, which then supports emissions calculations, reporting, and recommendations. Viewed end to end, the workflow takes a Bill of Materials from initial upload to Product Carbon Footprint reporting.
While the workflow runs as a single process inside Caly, viewing it in stages helps explain what happens between BOM upload and final reporting. It provides a clearer picture of how materials are mapped, how emissions are calculated, and how those calculations become actionable insights.
Conclusion
Every Product Carbon Footprint begins with data, but the value comes from what that data reveals. A Bill of Materials on its own is just a list of materials, components, and suppliers. When combined with emissions mapping and analysis, it becomes a way to see where emissions originate, which materials have the greatest impact, and where opportunities for improvement exist.
These connected stages help teams move from product information to meaningful carbon insights. From BOM upload and emission factor mapping to hotspot analysis and audit-ready reporting, each stage builds on the last, turning product information into actionable carbon intelligence. The result is not just a Product Carbon Footprint report, but a clearer understanding of the decisions that shape a product's environmental impact.
Ready to Turn BOM Data Into Carbon Intelligence?
See how Caly connects BOM data, emissions mapping, and reporting to help teams create traceable Product Carbon Footprints and identify improvement opportunities faster.
Book a DemoMore Insights
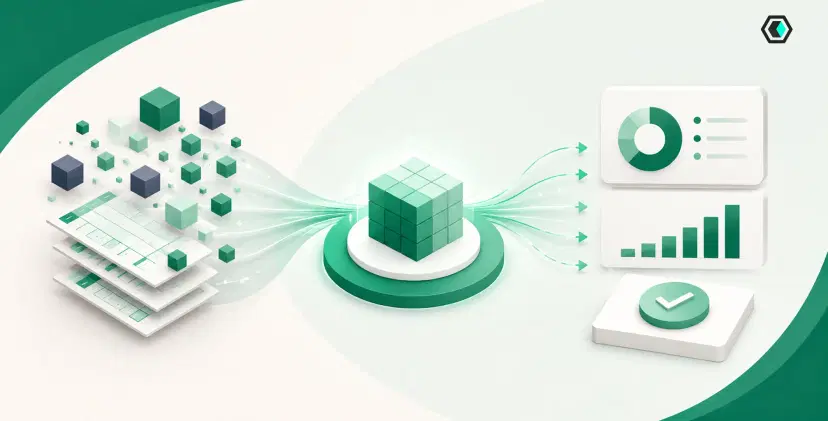
5 Carbon Reporting Bottlenecks Hidden Inside Product Data — And How Carbalyze Removes Them
Discover five common carbon reporting bottlenecks hidden within product data, including BOM management, emission factor mapping, Scope 1–3 data organization,...
5 Reviewer Questions That Expose Weaknesses in Carbon Reports — And How to Answer Them
A carbon report is more than a final emissions number—it's a record of the data, assumptions, and calculations behind it....
Before You Calculate a Product Carbon Footprint, Answer These 7 Questions First
Before starting a Product Carbon Footprint (PCF) calculation, manufacturers should evaluate data readiness, emission factor mapping, supplier data availability, reporting...
Fueled by intelligent systems to elevate your reading experience.