The Product Lifecycle Stages That Drive the Most Carbon Emissions

08 OCTOBER 2026
•
12 MIN READ
Introduction
The lifecycle stage responsible for the largest share of a product's carbon footprint varies from product to product. For some products, raw material extraction and processing are the largest contributors. For others, manufacturing, energy use during operation, transportation, or end-of-life treatment may account for a larger share.
That variation is why a category average or general rule of thumb does not establish the actual lifecycle emissions of a specific product. The result depends on the product's materials, manufacturing processes, energy requirements, distribution model, expected use, lifetime, and end-of-life pathway. Measuring emissions across the full lifecycle helps identify where the largest impacts occur and where reduction efforts can have the greatest effect.
This blog explains the five product lifecycle stages, examines the factors that influence emissions at each stage, and shows how to identify carbon hotspots across your products.
What Are Product Lifecycle Stages in Carbon Accounting?
Product lifecycle stages are the connected phases of a product's life used to organize the processes and greenhouse gas emissions included in a product inventory, commonly referred to as a Product Carbon Footprint (PCF).
The GHG Protocol Product Life Cycle Accounting and Reporting Standard uses five general lifecycle stages to organize product-level greenhouse gas emissions: material acquisition and pre-processing, production, distribution and storage, use, and end-of-life. The standard covers emissions associated with the full product life cycle, including raw materials, manufacturing, transportation, storage, use, and disposal.
The five stages are:
- Material acquisition and pre-processing : Covers the acquisition of materials and resources and the processes that prepare them for production.
- Production : Covers processes from when materials or components enter the production site through production of the finished product.
- Distribution and storage : Covers transportation and storage activities as the product moves through the distribution system toward the point where the consumer takes possession.
- Use : Covers emissions associated with the use of the product during its expected use period, based on the defined product system and relevant use assumptions. Direct use-phase emissions are included in the use-stage inventory, while indirect use-phase emissions are optional and, when included, are reported separately.
- End-of-life : Covers processes that occur after the product is discarded, including treatment, recycling, recovery, and disposal where applicable.
These five stages provide a general structure for organizing a product life cycle. The GHG Protocol notes that companies can further divide or classify stages to better reflect a specific product's life cycle, provided the boundaries are clear and logical and the stages remain consecutive and interlinked.
The stage breakdown is important because a total PCF shows the overall greenhouse gas emissions associated with a product, while results by lifecycle stage help identify where those emissions occur. The GHG Protocol Product Standard is intended to help organizations understand full lifecycle emissions and focus on opportunities to reduce them.
Which Lifecycle Stage Usually Has the Biggest Carbon Impact?
There is no single lifecycle stage that consistently has the largest carbon impact across all products. The result depends on the product's materials, manufacturing processes, distribution, energy or fuel requirements during use, expected lifetime, and end-of-life pathway.
Some general patterns can help provide context:
- Products with limited energy use during operation may have a larger share of emissions from material acquisition, pre-processing, and production.
- Products that consume electricity or fuel during use may have a substantial use-phase contribution, particularly when they operate for long periods or require significant energy.
- Products that rely heavily on agricultural or biological inputs may have significant emissions associated with material acquisition and pre-processing, depending on the raw materials and production system.
- Products with energy-intensive manufacturing or material processing may have production as a major contributor, even when their use-phase emissions are limited.
These are starting points rather than rules. The dominant stage can change significantly depending on the product design, material composition, manufacturing location and processes, energy sources, distribution model, use assumptions, and end-of-life treatment.
Use-phase results are particularly sensitive to assumptions such as expected lifetime, frequency of use, operating energy consumption, and the source of electricity or fuel. Changing these assumptions can change the relative contribution of lifecycle stages.
For this reason, lifecycle-stage contributions should be calculated using a defined product system, unit of analysis (functional unit), system boundary, data sources, and documented assumptions rather than inferred from product category alone.
The sections below examine each lifecycle stage and the factors that can influence its contribution to a product carbon footprint.
Material Acquisition and Pre-Processing: Where Many Footprints Begin
The material acquisition and pre-processing stage covers the acquisition of materials, including virgin and recycled materials, and their pre-processing before they enter the production stage. It can include resource extraction, acquisition of recycled materials, processing materials into intermediate inputs, and transportation of material inputs to the production facility.
For manufactured products, this stage often includes processes that take place outside the company's own facilities. Materials and components may pass through several upstream processes before reaching the production site. Understanding these upstream processes is therefore an important part of defining the product system and collecting the data needed for a PCF.
Several factors can influence emissions at this stage:
- Supplier and material data : The quality and specificity of available data can affect the accuracy of the inventory. Product-specific or process-specific data may be available for some inputs, while secondary data may be used where appropriate.
- Material selection : Different materials, grades, production processes, and recycled-content levels can result in different emissions profiles.
- Material quantity : The amount of each material or component used in the product contributes to the overall footprint.
- Upstream processing : Energy and material inputs required to produce intermediate materials and components are part of this stage.
- Transportation of inputs : Transportation of material inputs to the production facility is also included within this lifecycle stage under the GHG Protocol framework.
For products with complex supply chains, material acquisition and pre-processing can therefore represent an important part of the overall product carbon footprint. However, its contribution varies by product and should be determined through the product-level inventory rather than assumed in advance.
Measuring only activities inside the production facility does not capture these upstream processes. A complete product lifecycle assessment needs to account for the relevant material and component inputs that occur before the product enters its production stage.
Production: The Stage You Control Most Directly
Production covers the processes that take place from the point where materials or components enter the production site through production of the finished product. It can include energy use, process emissions, material losses, waste treatment and other relevant production activities.
For manufacturers, this stage often contains data that is relatively accessible because companies typically have records for electricity, fuels, production volumes, materials and waste. However, a product carbon footprint requires more than a facility-level total. When a facility produces multiple products, relevant inputs and emissions need to be attributed to the products using an appropriate and documented allocation approach where allocation is required.
The GHG Protocol provides a hierarchy for avoiding or performing allocation and requires companies to apply consistent allocation methods to similar inputs and outputs. The appropriate method depends on the process and the products or co-products involved.
Typical areas to investigate during the production stage include:
- Electricity and fuel consumption
- Process energy and heat
- Direct process emissions
- Material losses and production scrap
- Waste treatment
- Production efficiency
- Changes in manufacturing processes
Production can therefore be an important source of emissions and an important area for reduction efforts. Its contribution should be determined from the product-level inventory rather than assumed in advance.
The Use Phase: When Product Operation Drives Emissions
The use stage covers emissions associated with using the product during the defined use period. Its importance depends on how the product operates, how frequently it is used, how long it is used, and the energy or fuel required during operation.
For products that consume electricity or fuel during use, the use stage can represent a significant part of the overall footprint. Relevant factors can include:
- Energy or fuel consumption during operation
- Frequency and duration of use
- Expected product lifetime
- Electricity or fuel source
- Consumables required during use (indirect use-phase emissions, optional and reported separately)
- Operating conditions
Use-stage calculations therefore depend on clearly defined assumptions. A change in expected lifetime, operating pattern, energy consumption or energy source can change the calculated contribution of the use stage.
For products where use-phase emissions are significant, product design and energy efficiency can become important areas for reduction.
Distribution, Storage and End of Life: Important Parts of the Lifecycle
Distribution and storage cover activities that occur as a product moves from the production facility toward the point where the consumer takes possession. Relevant activities can include transportation, distribution-center operations and storage, including energy requirements for storage conditions where applicable.
The contribution of distribution and storage varies by product and supply chain. Factors such as transportation distance, transport mode, shipment weight, distribution routes and storage requirements can influence the result.
End of life begins after the consumer discards the product. It can include collection, transportation, sorting, recycling, recovery, treatment and disposal, depending on the product system and end-of-life pathway.
End-of-life accounting also requires attention to the treatment of recycled materials. The GHG Protocol Product Standard provides specific approaches for recycling allocation, including the recycled content method and closed-loop approximation method. The selected approach should be documented and applied consistently.
These stages should not be treated as automatically insignificant. Their contribution depends on the characteristics of the product and its lifecycle. A complete product-level assessment considers the relevant processes across all lifecycle stages rather than assuming in advance which stage will have the smallest impact.
Lifecycle Stage Comparison: What Tends to Dominate by Product Type
There is no universal lifecycle stage that dominates across all product categories. The relative contribution depends on the product system, materials, manufacturing processes, distribution, use profile, lifetime and end-of-life pathway.
| Product characteristics | Lifecycle stages to investigate closely | Practical question to ask |
|---|---|---|
| Products with substantial material inputs | Material acquisition and pre-processing | Which materials and upstream processes contribute most to the footprint? |
| Products with energy-intensive manufacturing | Production | Which processes, fuels and electricity uses drive production emissions? |
| Products that consume electricity or fuel during operation | Use | How much energy does the product require over its expected use period? |
| Products with complex distribution networks | Distribution and storage | Which transport and storage activities contribute to the footprint? |
| Products with significant recycling, recovery or disposal activities | End of life | What happens to the product after it is discarded? |
| Products with several significant stages | Multiple lifecycle stages | Which stage represents the largest contribution based on the product-level inventory? |
This table is a starting point for investigation, not a substitute for calculating the product footprint. The GHG Protocol Product Standard is designed to help organizations understand the full lifecycle and focus on the biggest reduction opportunities rather than assuming a particular stage will always dominate.
How to Find Your Own Carbon Hotspots Across Lifecycle Stages
If the dominant stage varies by product, the next step is to calculate and review the contribution of each relevant lifecycle stage.
- 1. Define the unit of analysis (functional unit). The unit of analysis provides the quantified reference for the product system. It should reflect what is being assessed and provide a consistent basis for the calculation and, where appropriate, comparison.
- 2. Set the system boundary. Define which processes and lifecycle stages are included in the assessment. A cradle-to-gate assessment covers the lifecycle through the production stage, while a cradle-to-grave assessment includes downstream stages through end of life, including use where applicable. The boundary should be clearly stated so the result can be interpreted correctly.
- 3. Collect data for each relevant stage. Collect the activity data and emission factors needed to quantify emissions across the defined product system. Primary data can be collected for processes across the product life cycle, including from suppliers and other value-chain activities, when suitable data is available. Secondary data can be used when appropriate primary data is unavailable or unsuitable.
- 4. Document allocation methods. Shared processes and co-products can require allocation. The GHG Protocol provides methods for avoiding or performing allocation and requires consistency when similar allocation situations occur.
- 5. Review the stage-level results. Look at the contribution of each lifecycle stage rather than relying only on the total PCF. This helps identify where the largest emissions occur and where further investigation or reduction work is most relevant.
- 6. Test important assumptions. For stages that depend heavily on assumptions, assess how changes in relevant parameters affect the result. Examples include product lifetime, operating conditions, energy sources, material choices and end-of-life pathways.
Common Mistakes When Reading Stage Results
- Treating a category average as the footprint of a specific product. Product-level emissions depend on the characteristics and lifecycle of the product being assessed.
- Ignoring the use profile. For products with operational energy or fuel requirements, lifetime and usage assumptions can materially affect the use-stage result.
- Comparing different system boundaries. A cradle-to-gate result should not be directly compared with a cradle-to-grave result without accounting for the difference in included processes.
- Assuming one lifecycle stage is always the largest. The dominant stage varies by product and its lifecycle.
- Using inconsistent allocation methods. Allocation choices can affect product-level results and should be documented and applied consistently.
- Reporting only the total footprint. A total shows the overall result, while lifecycle-stage results help identify where emissions occur and where reduction opportunities may exist.
Conclusion: Measure the Stages Before You Pick the Target
The lifecycle stage responsible for the largest share of a product's carbon footprint depends on the product system and the assumptions used to assess it. Material acquisition, production, distribution and storage, use, and end of life can all contribute to the result, with their relative importance varying across products.
For sustainability, procurement, product and compliance teams, the practical approach is to define the unit of analysis (functional unit) and system boundary, collect relevant data across the lifecycle, document assumptions and allocation methods, and review the results by lifecycle stage.
The GHG Protocol Product Standard is designed to help organizations understand full product lifecycle emissions and identify the areas where reduction efforts can have the greatest impact.
More Insights
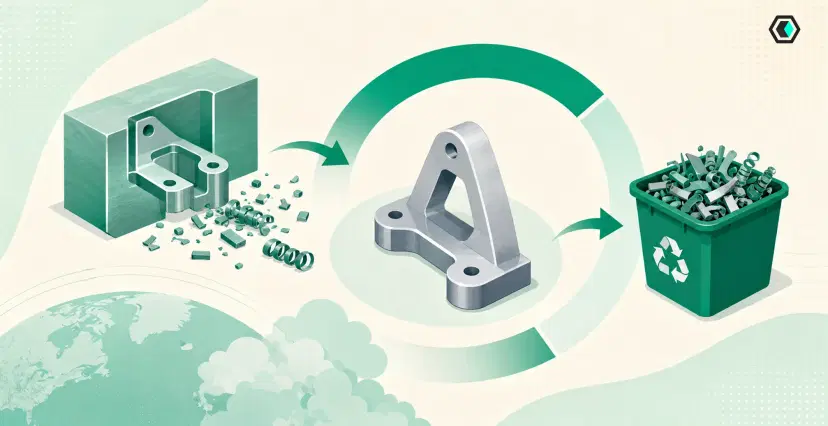
Net Weight vs Gross Weight in a BOM: Why Scrap Changes Your PCF
Net weight and gross weight represent different aspects of material use in a BOM, and that difference matters when calculating...
5 Common Factors That Affect Product Carbon Footprint Cost
Product carbon footprint cost can vary based on the system boundary, data quality, product complexity, methodology, and calculation approach. This...
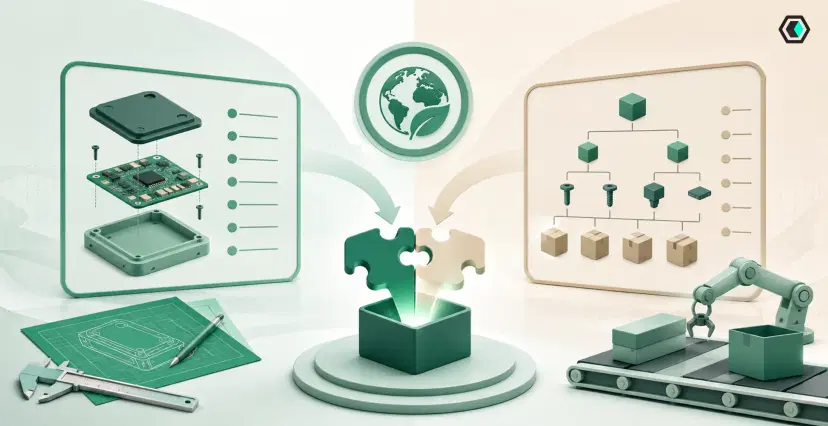
Engineering BOM vs Manufacturing BOM for PCF: What's the Difference and Which Should You Use?
Engineering and manufacturing BOMs provide different views of the same product, and both can contribute to Product Carbon Footprint calculations....
Fueled by intelligent systems to elevate your reading experience.