3 Common Challenges When Calculating Carbon Footprints for Hundreds of SKUs

27 AUGUST 2026
•
12 MIN READ
Introduction
A single product carbon footprint can require substantial manual effort, especially when product and supplier data must be collected, cleaned, and mapped. Multiply that across hundreds of SKUs, multiple supplier tiers, and BOMs that change over time, and the challenge quickly becomes a data-management problem, not just a calculation problem.
This can become a significant challenge for sustainability, procurement, and manufacturing teams. Customers and supply-chain partners may request environmental data from suppliers, while product teams can use carbon footprint data to understand how design changes affect emissions.
For companies managing large product portfolios, spreadsheet-based workflows can become difficult to scale as the number of products, data sources, and updates increases.
Calculating carbon footprints for hundreds of SKUs introduces additional data-management and consistency challenges compared with calculating one. Here are three key challenges that emerge at scale and what can help solve them.
Why Calculating PCFs for Hundreds of SKUs Is Different
A Product Carbon Footprint (PCF) measures the greenhouse gas emissions associated with a product, expressed in CO₂e, across a defined life-cycle boundary. For manufacturing, this may include emissions from raw materials through the production stage.
For each SKU, materials, quantities, suppliers, and other product data can differ. When hundreds of SKUs are involved, managing this information consistently can become much more challenging.
A smaller number of PCFs may be manageable manually, but scaling the process across hundreds of products can increase repetitive data collection, mapping, calculation, and review work.
Changes to product data can also require PCFs to be reviewed or recalculated, making it harder to keep a large portfolio accurate and up to date.
That leads to three key challenges.
Challenge 1: Managing Large Volumes of Product Data
One of the first challenges often appears before the emissions calculation itself: getting clean, structured product data in one place.
Multiple BOMs and product specifications
Hundreds of SKUs can mean hundreds of BOMs or BOM variations, which may be maintained across different teams, spreadsheets, and versions. Bringing this information into a consistent structure can become increasingly difficult as the product portfolio grows. BOMs can provide important material and quantity data used as activity data in product carbon footprint calculations.
Different data formats
Suppliers and internal teams may use different templates and formats. For example, one BOM might list materials by weight, another by percentage composition, and another by part number with limited material details. Reconciling these differences manually adds repetitive work.
Missing or inconsistent product information
At scale, data gaps can become harder to manage. A material might be listed without a supplier, a quantity might be missing a unit, or a component might have an incomplete description. These gaps can affect data completeness and reliability, which are important considerations in product GHG accounting.
Solution: Automated BOM Processing and Data Preparation
Standardizing BOM structures and automating how product data is ingested, checked, and organized can reduce repetitive manual preparation. Instead of preparing each BOM manually, product data can be uploaded and structured consistently before calculation begins.
Challenge 2: Maintaining Consistent Emission Factor Mapping Across SKUs
Once the product data is prepared, the relevant materials, components, and activities need to be associated with appropriate emissions data. An emission factor represents greenhouse gas emissions per unit of activity data used in the calculation.
Different material names and descriptions
The same or similar material can appear under different names across suppliers and BOMs. One supplier's '6061 aluminum' and another's 'aluminum alloy, extruded' may describe related material inputs, but they should not be assumed to require the same emission factor; the appropriate factor depends on their specifications and production characteristics.
Finding the appropriate emission factors
A single product can contain numerous material and component line items. A catalog of hundreds of SKUs can contain a large number of material and component line items, each of which may need to be associated with appropriate emissions data. The right choice can require judgment based on factors such as material, process, geography, and data quality.
Manual mapping errors
When mapping is done manually across hundreds of SKUs, the risk of inconsistent or incorrect mappings can increase. If the same incorrect mapping is reused across multiple SKUs, the error can propagate across the portfolio.
Solution: Automated Material-to-Emission-Factor Matching
Automating material-to-emission-factor matching can apply consistent mapping rules across SKUs while reducing repetitive manual work. Consistent methodology and mapping can also improve comparability across products when their boundaries, assumptions, and other methodological choices are aligned.
Challenge 3: Keeping Carbon Footprints Accurate When Product Data Changes
The first two challenges can be addressed during the initial calculation, but this one can recur whenever product or supplier data changes.
BOM and material changes
Products get reformulated. A packaging specification changes. A component gets replaced for cost or availability reasons. Some changes can make the existing carbon footprint no longer representative of the current product and may require the footprint to be reassessed or recalculated.
Supplier data updates
Suppliers may provide updated or more accurate emissions data. When appropriate, updated supplier-specific data can replace an earlier generic or secondary data source. Manually tracking which SKUs use which data source, and updating affected calculations, can be difficult to manage consistently.
Outdated calculations
Without a process to identify relevant changes, PCF results can become outdated. The reported number may no longer reflect the current product configuration or underlying data, which can create problems when outdated information is used in customer disclosures or other reporting.
Recalculating multiple affected SKUs
A single material or supplier change can affect multiple SKUs that share that input. Reviewing and, where necessary, recalculating affected products when a material or specification changes can create significant repetitive work in a large portfolio.
Solution: Automated Recalculation and Updated PCF Workflows
A structured PCF workflow can make it easier to identify which products may need review when BOM or supplier data changes. This can reduce manual tracking and help teams keep relevant PCFs up to date.
What Happens When PCF Calculation Is Done Manually at Scale?
When these three challenges are handled manually, the effects can compound across the sustainability program.
- More time spent on repetitive work : Teams can spend significant time on data entry, formatting, and resolving missing information, work that does not directly reduce emissions.
- Higher risk of inconsistencies : Different people making different judgment calls on data gaps, material mapping, or methodology can produce footprints that are difficult to compare reliably across the catalog. GHG Protocol emphasizes consistency, transparency, and data quality in GHG accounting.
- Difficulties maintaining hundreds of PCFs : Keeping hundreds of individual calculations current, each with its own data sources and assumptions, can become increasingly difficult to manage consistently with a manual spreadsheet-based process.
- Limited traceability : When a customer, auditor, or internal stakeholder asks where a specific number came from, a poorly documented manual process may make it difficult to provide a clear, consistent answer for every SKU. GHG Protocol emphasizes maintaining a clear audit trail and documenting relevant assumptions, methodologies, and data sources.
How Carbalyze Helps Manufacturers Calculate PCFs at Scale
Carbalyze is built around Caly, an AI-powered sustainability assistant designed to turn Bill of Materials data into product carbon footprints while reducing the need for extensive in-house LCA expertise. The workflow covers several of the manual steps involved in PCF calculation at scale.
- Upload BOMs : Product data can be uploaded directly in Excel or CSV format, whether it covers raw materials, components, or finished products, reducing the need to manually prepare each BOM.
- Automate data preparation : Caly processes the uploaded BOM data, reducing manual data preparation before calculation.
- Map materials to emission factors : Caly's engine automatically maps material-level emissions by cross-referencing BOM data against industry-standard emission factor databases, applying automated mapping to materials as they're processed.
- Calculate product carbon footprints : Product carbon footprints can be calculated using relevant product and supply-chain emissions data, including applicable Scope 1, 2, and 3 emissions sources.
- Identify carbon hotspots : The platform highlights where emissions are concentrated within a product, supporting reduction planning rather than just reporting a final number.
- Generate reports : Carbalyze generates reports aligned with standards and frameworks including the GHG Protocol and ISO 14067, along with recommendations for reducing product emissions based on identified hotspots.
A Scalable PCF Workflow for Growing Product Portfolios
Put together, a scalable workflow looks less like a single calculation and more like a pipeline: BOM data enters in supported formats such as Excel or CSV, gets processed and structured for analysis, is mapped against relevant emission factor data, and flows out as a structured PCF report for each analyzed product. Carbalyze brings BOM processing, emissions mapping, calculations, hotspot identification, and reporting into a connected workflow.
This is the structural difference between a process built for one product and one built for a catalog. It is not just faster math. It is a workflow designed to support a growing product catalog.
When Should Manufacturers Automate PCF Calculations?
Not every team needs to automate on day one, but several signals can indicate that automation would be valuable.
- Number of SKUs : As a catalog grows from a handful of products into larger product portfolios, manual tracking can become increasingly difficult to manage consistently.
- Frequency of product changes : If BOMs, supplier data, or specifications change regularly, automated workflows can make it easier to identify affected products and keep calculations up to date.
- Customer PCF requests : When customers or business partners request product-level carbon data more frequently, ad hoc responses can become difficult to manage at scale.
- Supplier data volume : The more suppliers involved across the portfolio, the more valuable a standardized, automated data-intake process can become.
- Reporting requirements : As product carbon footprints start feeding into external disclosures or customer-facing claims, traceability and consistency become increasingly important.
Scale Your Product Carbon Footprint Calculations With Carbalyze
Calculating carbon footprints across a large SKU portfolio involves real complexity: BOM data needs to be organized and usable, materials need to be mapped to appropriate emission factors, and calculations need to be reviewed as product data changes.
Carbalyze helps manufacturers streamline these steps through a connected workflow for BOM processing, emission factor mapping, PCF calculation, hotspot analysis, and reporting. Instead of managing each product calculation separately, teams can use a more consistent process designed to scale across their product portfolio.
Ready to Calculate PCFs Across Your Product Portfolio?
Turn your BOM data into structured Product Carbon Footprints with standardized emission factor mapping, transparent calculations, and a workflow designed to support a growing number of SKUs.
Book a DemoMore Insights
The Product Lifecycle Stages That Drive the Most Carbon Emissions
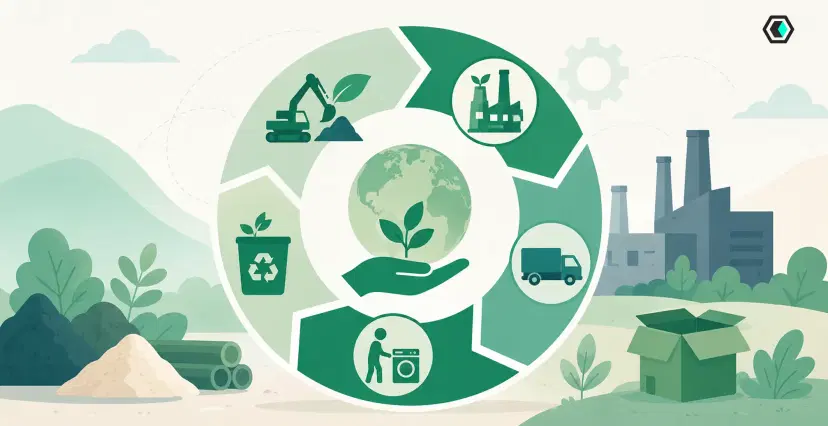
This blog explains how each product lifecycle stage contributes to a product's carbon footprint, from material acquisition and production to...
Net Weight vs Gross Weight in a BOM: Why Scrap Changes Your PCF
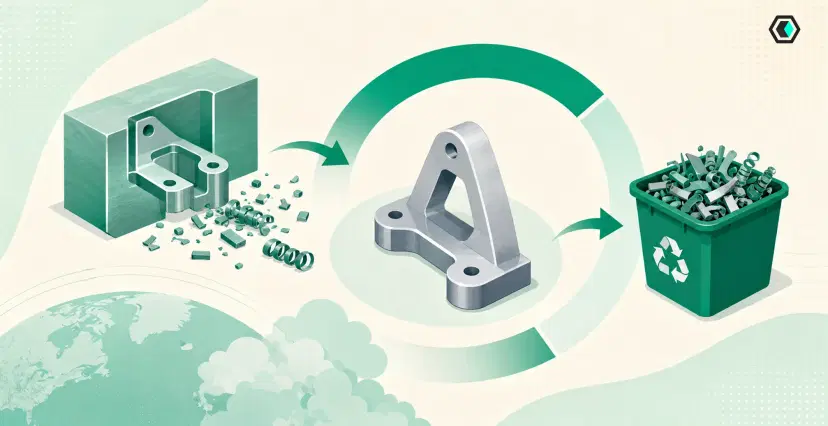
Net weight and gross weight represent different aspects of material use in a BOM, and that difference matters when calculating...

5 Common Factors That Affect Product Carbon Footprint Cost
Product carbon footprint cost can vary based on the system boundary, data quality, product complexity, methodology, and calculation approach. This...
Fueled by intelligent systems to elevate your reading experience.