Scope 1 vs Scope 2 vs Scope 3: What Each Report Actually Measures

25 AUGUST 2026
•
10 MIN READ
Introduction
A product's carbon footprint can be influenced by emissions from activities that fall across Scope 1, Scope 2, and Scope 3 in a company's corporate emissions inventory. Scope 1 covers direct emissions from sources such as fuel burned in your factory. Scope 2 covers indirect emissions associated with purchased electricity, steam, heat, or cooling. Scope 3 captures relevant emissions across the value chain, including suppliers, transportation, product use, and end-of-life.
If you have ever compared two carbon reports and wondered why the totals do not match, differences in scope, boundaries, methodology, data, or reporting periods may all be responsible. Scope 1, Scope 2, and Scope 3 are not interchangeable labels. They classify different types of emissions, rely on different data sources, and can vary significantly in calculation complexity. Getting these boundaries right is essential for credible corporate emissions inventories and for correctly interpreting how corporate value-chain emissions relate to a Product Carbon Footprint (PCF).
This guide breaks down what each scope actually measures, how they interact, and what sustainability teams and manufacturers need to know before building or reviewing a carbon report.
Where the Scope System Comes From
The Scope 1, Scope 2, and Scope 3 framework is defined within the Greenhouse Gas Protocol's corporate accounting standards. Its purpose is to categorize a company's greenhouse gas emissions according to whether they arise directly from sources owned or controlled by the organization, from purchased energy, or from other activities across its value chain.
The GHG Protocol's Corporate Standard covers seven greenhouse gases: carbon dioxide, methane, nitrous oxide, hydrofluorocarbons, perfluorocarbons, sulphur hexafluoride, and nitrogen trifluoride. The framework categorizes emissions according to their relationship to the reporting organization rather than simply by the type of greenhouse gas involved. This distinction forms the basis for Scope 1, Scope 2, and Scope 3.
Before going further, it helps to define the terms precisely. In corporate GHG accounting, Scope 1 covers direct emissions from sources owned or controlled by the organization. Scope 2 covers indirect emissions associated with purchased or acquired electricity, steam, heat, and cooling. Scope 3 covers other relevant indirect emissions across the organization's value chain.
Scope 1: Direct Emissions From Owned or Controlled Sources
Scope 1 covers direct greenhouse gas emissions from sources a company owns or controls. If your business directly burns fuel in equipment it owns or controls, or releases refrigerants from equipment within its organizational boundary, those emissions are generally reported as Scope 1.
According to the US Environmental Protection Agency, Scope 1 emissions are direct greenhouse gas emissions from sources that an organization owns or controls, including fuel combustion in boilers, furnaces, and vehicles.
Typical Scope 1 sources in a manufacturing environment include:
- Natural gas or fuel oil burned in on-site boilers and furnaces
- Fuel consumed by company-owned delivery trucks or forklifts
- Emissions from chemical reactions in production processes
- Refrigerant leaks from owned cooling and HVAC systems
The key distinction is whether the emissions come directly from sources owned or controlled by the reporting organization, based on its chosen organizational boundary approach. If your company owns or controls the equipment and directly burns fuel in it, the resulting direct emissions are generally reported as Scope 1.
Scope 2: Indirect Emissions From Purchased Energy
Scope 2 covers indirect emissions generated elsewhere, at a power plant, for example, as a result of an organization's consumption of purchased or acquired energy. This includes purchased electricity, steam, heat, and cooling.
The EPA defines Scope 2 emissions as indirect emissions associated with the purchase of electricity, steam, heat, or cooling. Although these emissions physically occur at the facility that generates the energy, they are included in the purchasing organization's inventory because they are associated with its energy consumption.
A useful way to picture Scope 2 is this: if you flip a switch and a light turns on, the emissions associated with generating that electricity are included in your organization's Scope 2 inventory, even though the power plant that produced the electricity is owned by someone else.
Scope 2 matters because purchased electricity and other forms of energy are common sources of indirect emissions for many organizations. It can also be an actionable category. Depending on the accounting method, applicable contractual instruments, and the organization's energy arrangements, renewable electricity procurement, power purchase agreements, and on-site renewable generation can affect reported Scope 2 emissions.
Scope 3: The Value Chain Emissions Many Reports Miss
Scope 3 is where things get more complicated, and it often represents the largest share of a company's total greenhouse gas footprint.
The EPA describes Scope 3 emissions as resulting from activities involving assets not owned or controlled by the reporting organization, but which the organization indirectly affects through its value chain. These emissions include both upstream activities, such as raw material extraction and supplier manufacturing, and downstream activities, such as product use and end-of-life treatment.
The GHG Protocol's Corporate Value Chain (Scope 3) Standard organizes Scope 3 emissions into 15 defined categories covering activities such as purchased goods and services, transportation and distribution, business travel, employee commuting, use of sold products, and end-of-life treatment of sold products.
Common Scope 3 sources for a manufacturer include:
- Raw materials and components purchased from suppliers
- Emissions from third-party transportation and logistics
- Employee commuting and business travel
- Energy consumed by customers using the finished product
- Emissions from disposing of the product at the end of its life
Scope 3 often represents the majority of a company's total greenhouse gas emissions, although the proportion varies significantly by company and sector. Separately, CDP and BCG found that in 2023, corporates reported their upstream Scope 3 supply-chain emissions were, on average, 26 times greater than their emissions from direct operations, or Scope 1 and Scope 2. That multiple applies specifically to upstream supply-chain emissions rather than all Scope 3 activity, but it illustrates how, for many companies, value-chain emissions can substantially exceed emissions from direct operations.
For companies where Scope 3 represents a significant share of total emissions, stopping at Scope 1 and Scope 2 can leave out a substantial portion of the organization's value-chain footprint.
Scope 1 vs Scope 2 vs Scope 3: Side-by-Side Comparison
| Scope 1 | Scope 2 | Scope 3 | |
|---|---|---|---|
| What it measures | Direct emissions from owned or controlled sources | Indirect emissions associated with purchased or acquired energy | Other indirect emissions across the value chain |
| Example source | Fleet vehicle fuel, on-site boilers, process emissions | Purchased electricity, steam, heat, cooling | Supplier materials, transportation, product use, end-of-life |
| Relationship to emission source | Direct emissions from sources owned or controlled by your organization | Indirect emissions associated with purchased or acquired energy | Other indirect emissions from relevant value-chain activities |
| Share of total footprint | Varies significantly by organization | Varies significantly by organization | Often the largest share, depending on sector and activities |
| Data difficulty | Generally lower, using fuel, equipment, and activity records | Moderate, using energy consumption data and applicable emission factors | Generally higher, often requiring supplier data, activity data, and estimates |
| Useful data sources | Fuel records, equipment data, activity records | Energy invoices, consumption data, applicable emission factors | Supplier-specific data, BOMs, activity data, and relevant emission-factor databases |
Why a Product Carbon Footprint Needs a Life-Cycle View
A Product Carbon Footprint (PCF), as defined under ISO 14067, quantifies the greenhouse gas emissions and removals associated with a product across its life cycle. Depending on the system boundary, this can include raw materials, manufacturing, distribution, use, and end-of-life. These life-cycle stages can include emissions that fall under Scope 1, Scope 2, and Scope 3 within a company's corporate inventory.
For a manufactured product, Scope 1 may include direct fuel combustion during production, Scope 2 may include emissions associated with purchased electricity, and Scope 3 may include emissions from purchased materials, transportation, product use, and end-of-life treatment.
This is where automated PCF tools can help. Carbalyze's Caly platform uses a Bill of Materials (BOM) as a starting point for product-level emissions analysis and helps map relevant materials and suppliers to emission factors. The workflow supports supplier-level data and methodologies aligned with frameworks such as the GHG Protocol and ISO 14067.
For manufacturers, the BOM provides a practical starting point for understanding a product's emissions profile. Mapping materials and components to supplier-specific data or appropriate emission factors helps build a more detailed picture of the product's life-cycle emissions.
How Scope 1, 2, and 3 Interact Across a Supply Chain
Scope classification depends on who is reporting. The same physical emissions can be classified differently depending on the organization's relationship to the source. For example, a supplier's Scope 1 emissions can become part of a customer's Scope 3 inventory.
Consider a component supplier using natural gas to operate its stamping presses. For the supplier, those emissions are Scope 1. For the manufacturer purchasing the component, the associated emissions can fall under Scope 3, Category 1: Purchased Goods and Services.
Supplier collaboration can improve Scope 3 accuracy by providing activity data, emissions data, material information, or product-level carbon data. When supplier-specific data is unavailable, companies can use secondary or industry-average emission factors to estimate emissions. High-quality supplier data can provide a more representative picture of the purchased product's footprint.
Common Mistakes When Comparing Scope Reports
Even experienced sustainability teams can run into common issues when working across Scope 1, Scope 2, and Scope 3.
Treating Scope 3 as optional. Excluding relevant Scope 3 categories can leave a significant part of the value-chain footprint unaccounted for, especially when supplier data is limited.
Double counting emissions. The same physical emissions can appear in different organizations' inventories. Clear organizational boundaries help prevent double counting within an individual inventory.
Mixing corporate and product boundaries. Corporate carbon inventories and Product Carbon Footprints use related but distinct accounting approaches. Applying corporate scope classifications directly to a product without an appropriate system boundary and allocation method can distort results.
Using outdated or generic emission factors. Poorly matched emission factors can produce results that appear precise but do not accurately represent the materials, processes, geography, or suppliers involved.
Comparing inconsistent data. Different reporting periods, units, methodologies, or intensity metrics can make Scope 1, 2, and 3 figures difficult to compare reliably.
Reading a Scope Report Without Getting Lost
When reviewing a carbon report, check that the reporting boundary, included scopes, and exclusions are clearly stated.
For Scope 3, review which of the 15 categories are included, excluded, and why. Also check the data sources, emission factors, reporting period, methodology, and key assumptions.
A transparent report that clearly explains its methodology and limitations is more useful than one that presents emissions figures without showing how they were calculated.
Conclusion
Scope 1, Scope 2, and Scope 3 are not three versions of the same measurement. They classify emissions from different sources and perspectives. Scope 1 covers direct emissions from sources an organization owns or controls. Scope 2 covers indirect emissions associated with purchased or acquired energy. Scope 3 covers other indirect emissions across relevant activities in the value chain.
For sustainability managers, procurement teams, and manufacturers building a Product Carbon Footprint, the key is to define the appropriate product and reporting boundaries, use consistent methodologies, and trace calculations back to reliable data and documented assumptions. Understanding how corporate Scope 1, 2, and 3 emissions relate to a product's life-cycle emissions can help teams build more complete and defensible carbon assessments.
Ready to Calculate Your Product Carbon Footprint?
Turn product and supplier data into a traceable PCF with consistent calculations, relevant emission factors, and transparent reporting.
Book a DemoMore Insights
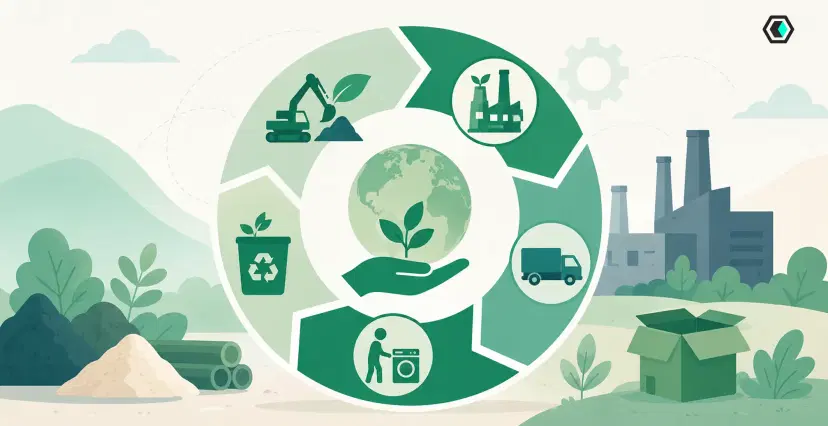
The Product Lifecycle Stages That Drive the Most Carbon Emissions
This blog explains how each product lifecycle stage contributes to a product's carbon footprint, from material acquisition and production to...
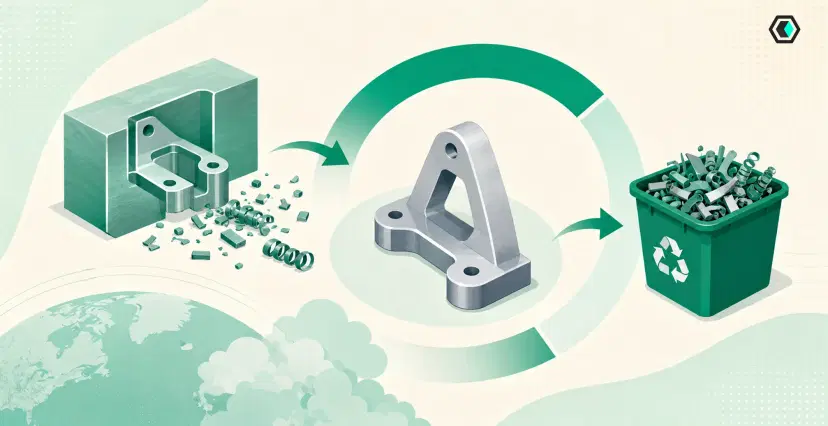
Net Weight vs Gross Weight in a BOM: Why Scrap Changes Your PCF
Net weight and gross weight represent different aspects of material use in a BOM, and that difference matters when calculating...
5 Common Factors That Affect Product Carbon Footprint Cost
Product carbon footprint cost can vary based on the system boundary, data quality, product complexity, methodology, and calculation approach. This...
Fueled by intelligent systems to elevate your reading experience.